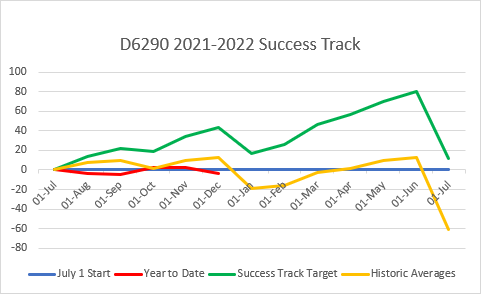
- The green line shows the growth pattern your district would need to achieve in order to end the year having grown .5%. You can see how much your membership needs to grow to accommodate the decline that occurs every January and July.
- The yellow line shows your district’s 4-year historic average. In other words, this is what you would expect to see if the year unfolds as it usually does.
- The red line shows your actual growth this year to the end of November.